Home
Bibliography
Contact
Interesting Articles
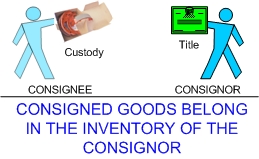
Another problem area pertains to goods on consignment. Consigned goods describe products that are in the custody of one party, but belong to another. Thus, the party holding physical possession is not the legal owner. The person with physical possession is known as the consignee. The consignee is responsible for taking care of the goods and trying to sell them to an end customer. In essence, the consignee is acting as a sales agent. The consignor is the party holding legal ownership/title to the consigned goods in inventory. Because consigned goods belong to the consignor, they should be included in the inventory of the consignor -- not the consignee!
INVENTORY AND ITS IMPORTANCE TO INCOME MEASUREMENT
Even a casual observer of the stock markets will note that stock values often move significantly on information about a company's earnings. Now, you may be wondering why a discussion of inventory would begin with this observation. The reason is that inventory measurement bears directly on the determination of income!
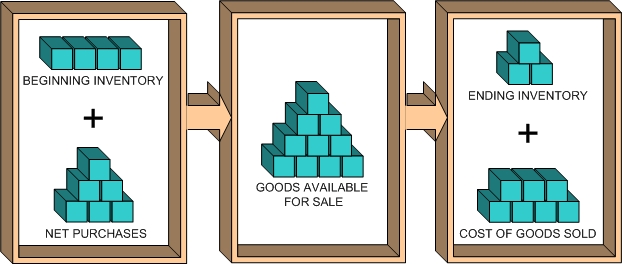
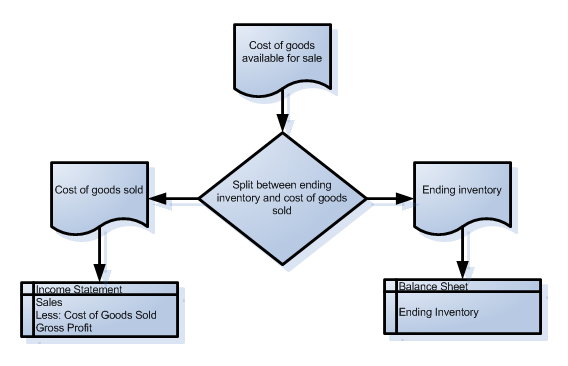
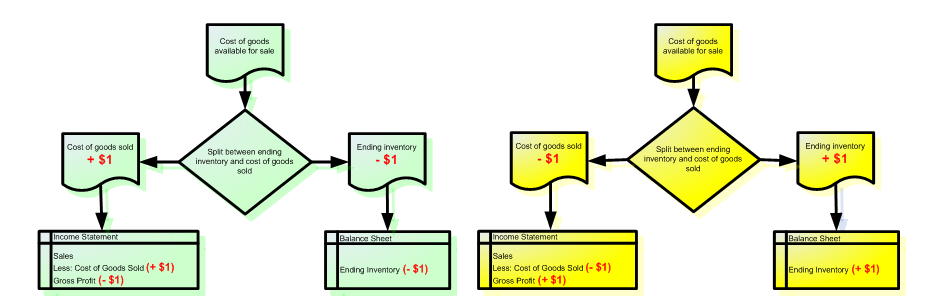
Notice that the goods available for sale are "allocated" to ending inventory and cost of goods sold. In the graphic, the units of inventory appear as physical units. But, in a company's accounting records, this flow must be translated into units of money. After all, the balance sheet expresses inventory in money, not units. And, cost of goods sold on the income statement is also expressed in money:
DETERMINING THE COST OF ENDING INVENTORY:
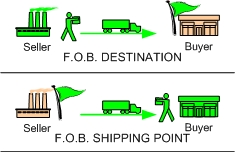
Inventory should include all costs that are "ordinary and necessary" to put the goods "in place" and "in condition" for their resale. This means that inventory cost would include the invoice price, freight-in, and similar items relating to the general rule. Conversely, "carrying costs" like interest charges (if money was borrowed to buy the inventory), storage costs, and insurance on goods held awaiting sale would not be included in inventory accounts; instead those costs would be expensed as incurred. Likewise, freight-out and sales commissions would be expensed as a selling cost rather than being included with inventory.
Once the unit cost of inventory is determined via the preceding rules of logic, specific costing methods must be adopted. In other words, each unit of inventory will not have the exact same cost, and an assumption must be implemented to maintain a systematic approach to assigning costs to units on hand (and to units sold). To see Costing Methods click here!
PERPETUAL INVENTORY SYSTEMS
All of the Costing Methods illustrated were based on the periodic inventory system. In other words, the ending inventory was counted and costs were assigned only at the end of the period. A more robust system is the perpetual system. With a perpetual system, a running count of goods on hand is maintained at all times. Modern information systems facilitate detailed perpetual cost tracking for those goods.
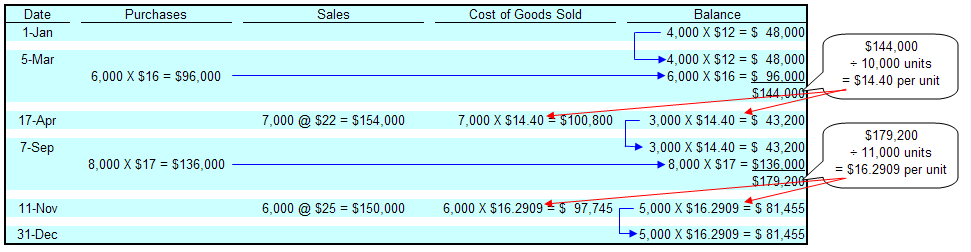
PERPETUAL FIFO: The following table reveals the application of the perpetual inventory system -- using a FIFO approach:
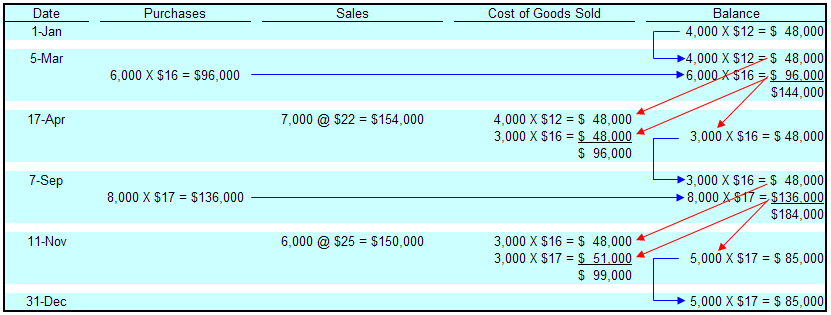
Two points come to mind when examining this table. First, there is considerable detail in tracking inventory using a perpetual approach; thank goodness for computers. Second, careful study is needed to discern exactly what is occurring on each date. For example, look at April 17 and note that 3,000 units remain after selling 7,000 units. This is determined by looking at the preceding balance data on March 5 (consisting of 10,000 total units (4,000 + 6,000)), and removing 7,000 units as follows: all of the 4,000 unit layer, and 3,000 of the 6,000 unit layer. Remember, this is the FIFO application, so the layers are peeled away based on the chronological order of their creation. In essence, each purchase and sale transaction impacts the residual composition of the layers associated with the item of inventory. Realize that this type of data must be captured and maintained for each item of inventory if the perpetual system is to be utilized; a task that was virtually impossible before cost effective computer solutions became commonplace. Today, the method is quite common, as it provides better "real-time" data needed to run a successful business.
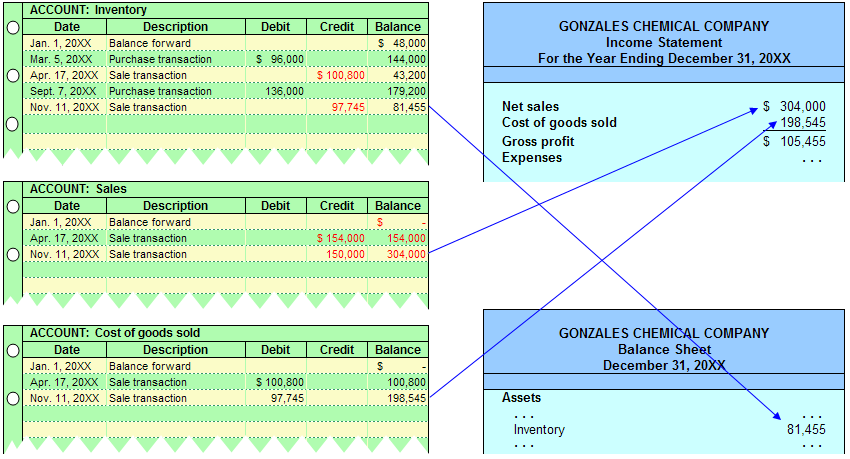
JOURNAL ENTRIES: The table above provides information needed to record purchase and sale information. Specifically, Inventory is debited as purchases occur and credited as sales occur. Following are the entries:
| 3-5-XX |
Inventory |
96,000 |
||
| Accounts Payable |
96,000 |
|||
| Purchased $96,000 of inventory on account (6,000 X $16) | ||||
| 4-17-XX |
Accounts Receivable |
154,000 |
||
| Sales |
154,000 |
|||
| Sold merchandise on account (7,000 X $22) | ||||
| 4-17-XX |
Cost of Goods Sold |
96,000 |
||
| Inventory |
96,000 |
|||
| To record the cost of merchandise sold ((4,000 X $12) + (3,000 X $16)) | ||||
| 9-7-XX |
Inventory |
136,000 |
||
| Accounts Payable |
136,000 |
|||
| Purchased $136,000 of inventory on account (8,000 X $17) | ||||
| 11-11-XX |
Accounts Receivable |
150,000 |
||
| Sales |
150,000 |
|||
| Sold merchandise on account (6,000 X $25) | ||||
| 11-11-XX |
Cost of Goods Sold |
99,000 |
||
| Inventory |
99,000 |
|||
| To record the cost of merchandise sold ((3,000 X $16) + (3,000 X $17)) | ||||
Let's see how these entries impact certain ledger accounts and the resulting financial statements:

If you are very
perceptive, you will note that this is the same thing that resulted
under the periodic FIFO approach introduced earlier. So,
another
general observation is in order: The FIFO method will produce
the
same financial statement results no matter whether it is applied on a
periodic or perpetual basis. This occurs because the
beginning
inventory and early purchases are peeled away and charged to cost of
goods sold -- whether the associated calculations are done "as you go"
(perpetual) or "at the end of the period" (periodic).
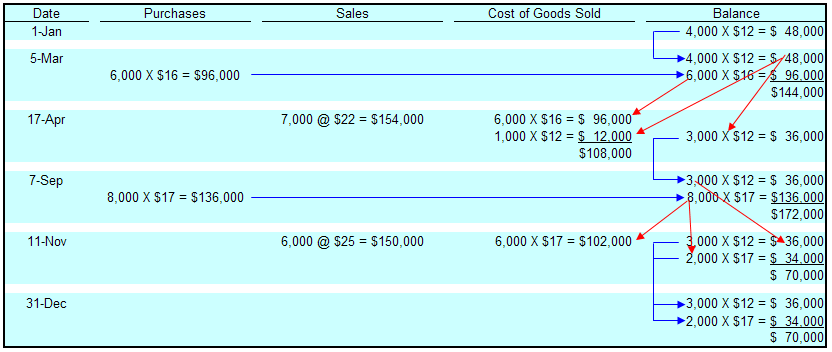
PERPETUAL LIFO: LIFO can also
be applied on a
perpetual basis. This time, the results will not be the same
as
the periodic LIFO approach (because the "last-in" layers are constantly
being peeled away, rather than waiting until the end of the
period). The following table reveals the application of a
perpetual LIFO approach. Study it carefully, this time noting
that sales transactions result in a peeling away of the most recent
purchase layers. The journal entries are not repeated here for the LIFO
approach. Do note, however, that the accounts would be the
same
(as with FIFO); only the amounts would change.

MOVING
AVERAGE: The average
method can also be applied on a perpetual basis, earning it the name
"moving average" approach. This technique is considerably
more
involved, as a new average unit cost must be computed with each
purchase transaction. For the last time, we will look at the
Gonzales Chemical Company data:
The resulting
financial data using the moving-average approach are:
As with the periodic system, observe
that the
perpetual system produced the lowest gross profit via LIFO, the highest
with FIFO, and the moving-average fell in between.
INVENTORY
MANAGEMENT
Inventory Turnover Ratio = Cost of Goods Sold/Average Inventory
If a company's average inventory was $1,000,000, and the annual cost of goods sold was $8,000,000, you would deduce that inventory turned over 8 times (approximately once every 45 days). This could be good or bad depending on the particular business; if the company was a baker it would be very bad news, but a lumber yard might view this as good. So, general assessments are not in order. What is important is to monitor the turnover against other companies in the same line of business, and against prior years' results for the same company. A declining turnover rate might indicate poor management, slow moving goods, or a worsening economy. In making such comparisons and evaluations, you should now be clever enough to recognize that the choice of inventory method affects the reported amounts for cost of goods sold and average inventory. As a result, the impacts of the inventory method in use must be considered in any analysis of inventory turnover ratios.
INVENTORY ERRORS
In the process of maintaining inventory records and the physical count of goods on hand, errors may occur. It is quite easy to overlook goods on hand, count goods twice, or simply make mathematical mistakes. Therefore, it is vital that accountants and business owners fully understand the effects of inventory errors and grasp the need to be careful to get these numbers as correct as possible.
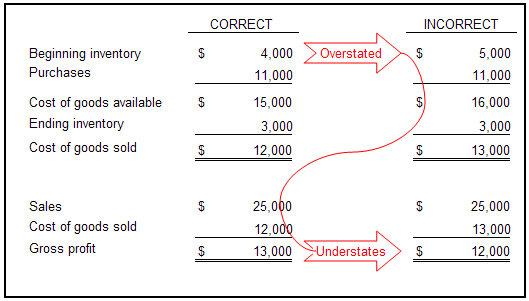
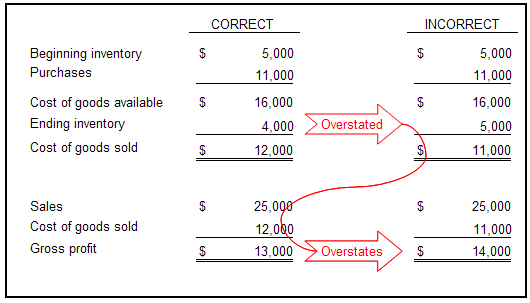
A general rule is that overstatements of ending inventory cause overstatements of income, while understatements of ending inventory cause understatements of income. For instance, compare the following correct and incorrect scenario -- where the only difference is an overstatement of ending inventory by $1,000 (note that purchases were correctly recorded -- if they had not, the general rule of thumb would not hold):
Inventory errors tend to be counterbalancing. That is, one year's ending inventory error becomes the next year's beginning inventory error. The general rule of thumb is that overstatements of beginning inventory cause that year's income to be understated, while understatements of beginning inventory cause overstatements of income. Examine the following table where the only error relates to beginning inventory balances: